KNIME Analytics is a low code platform for analytics, in which visual programming paradigm is implemented through the use of workflows. Nodes representing actions on data are linked, sequentially, as a DAG. A Year of Pumpkins dataset has information about the prices of pumpkins for months in 2016 and 2017, as well as other information including packaging, sizes, type for 13 different cities in the USA.
The dataset is actually made up of multiple datasets, each for a separate city. Using the CSV Reader node, all 13 files could be read at once. However, because some of the files had more columns, an option to catch the error had to be relaxed. The columns are as below:
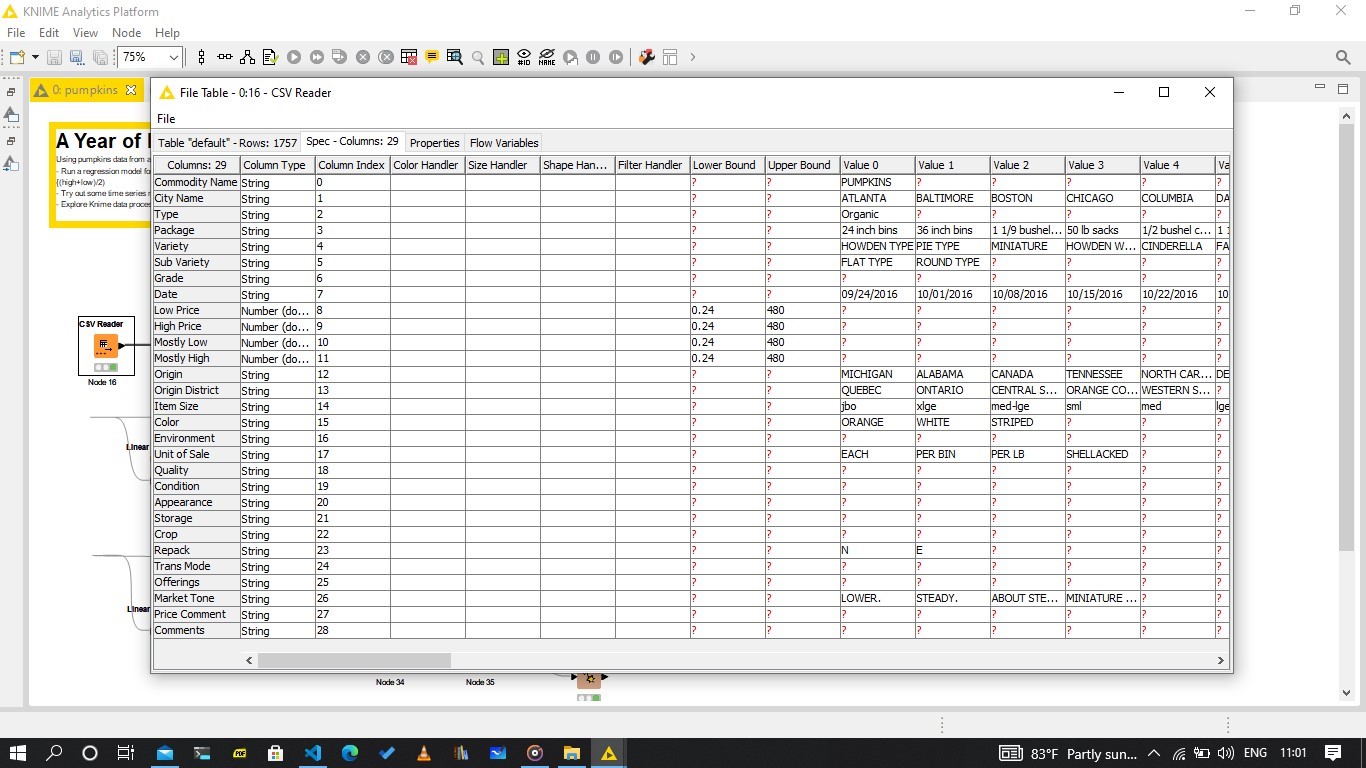
The last 4, are not in most of the other csv files, and so had to be removed using the Column Filter node. Other columns with no valuable information were also removed, as well as those with over 40% missing values with Missing Value Column Filter node.
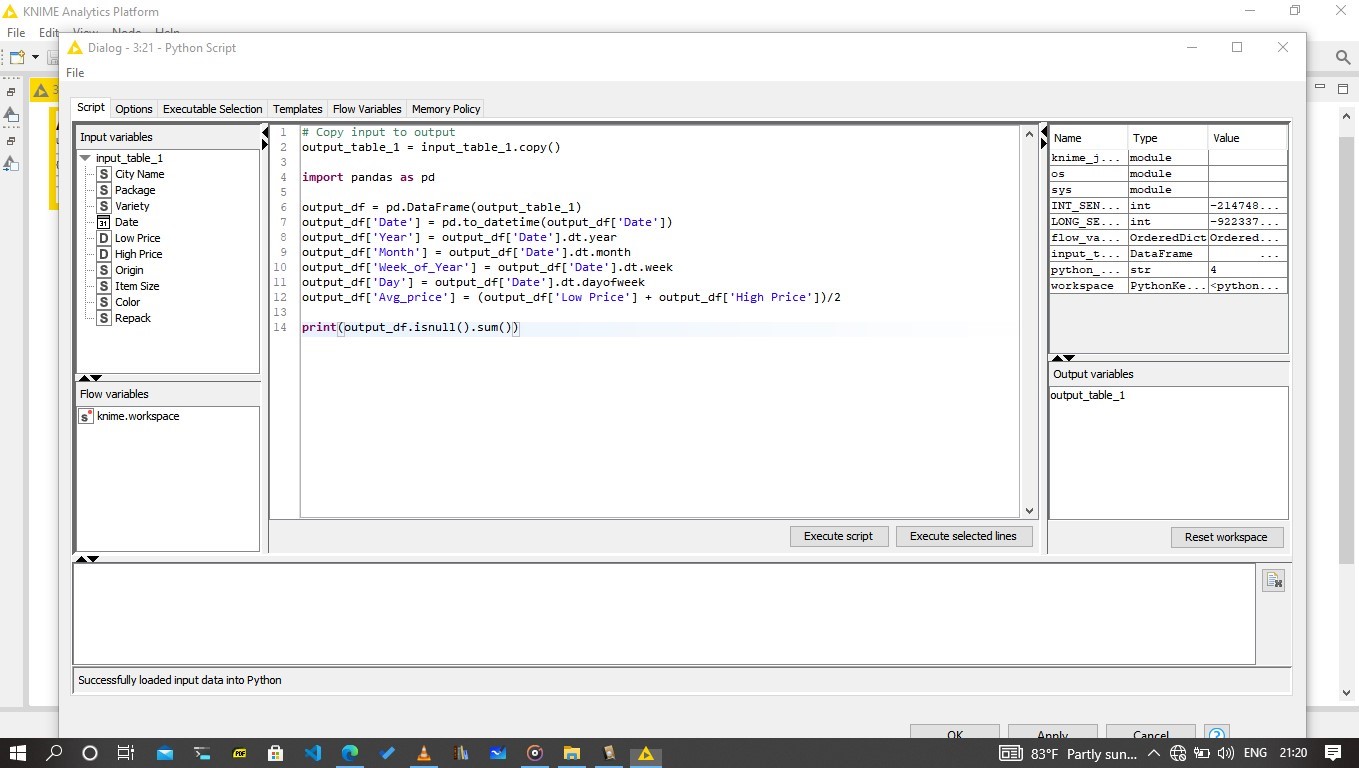
Column Date was transformed into datetime, using Pandas. Knime can integrate python (and other languages including R and Java). The date was then used to access, using dt, week, month and week information which might be useful in determining price levels. Also the average price was calculated from low and high for the day.
The linear regression is a base line to benchmark the performance. The data was split 70:30 using the Partitioning node, and a Linear Regression Learner and Linear Regression Predictor were used to train and predict on the test set. The regression was run on 11 columns.
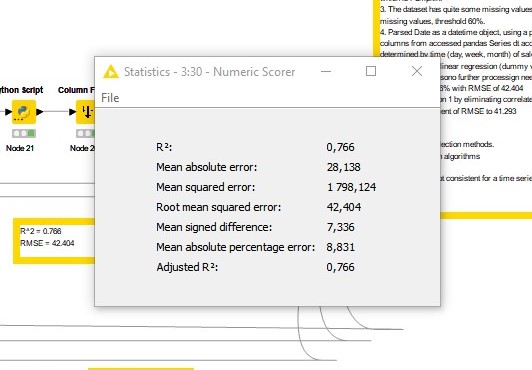
Results of the linear regression, including R-squared for model fit and RMSE for performance.
Linear correlation was used to remove corelated features. 2 columns were removed and training and predict done.
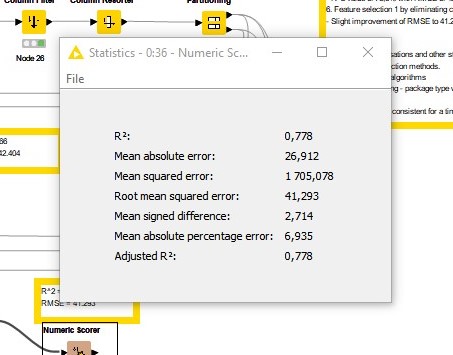
Removing the correlated features resulted in a slight improvement in the RMSE, falling to 41.293 from 42.04.
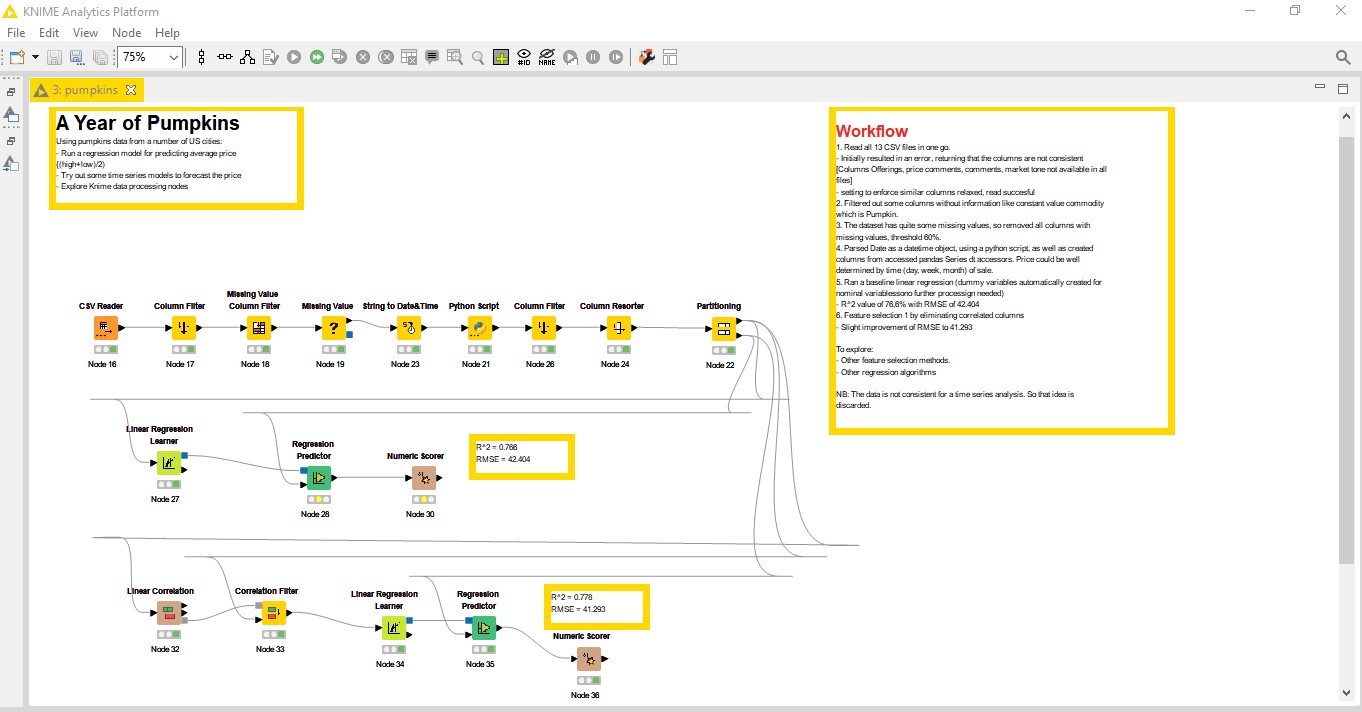 Whole workflow
Other ideas to explore: 1. H2o regression and tree regression - to explore feature importances 2. Regularisation methods for regresssion - LASSO, Ridge 3. SVM 4. Packaging - there are different packages measurements, see if they can be standardised. 5. Visualisations